HTML 表格基础知识
本文将带你开始使用 HTML 表格,涵盖行、单元格、标题等基础知识,使单元格跨越多列和行,以及如何将列中的所有单元格组合在一起以实现样式设置。
¥This article gets you started with HTML tables, covering the very basics such as rows, cells, headings, making cells span multiple columns and rows, and how to group together all the cells in a column for styling purposes.
| 先决条件: | HTML 基础知识(参见 HTML 简介)。 |
|---|---|
| 目标: | 基本熟悉 HTML 表格。 |
什么是表格?
¥What is a table?
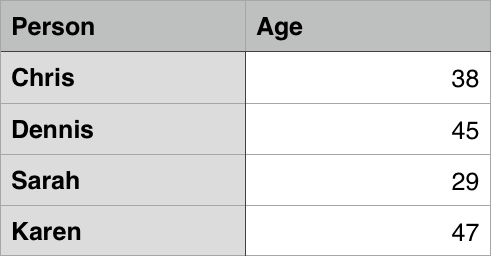
表是由行和列(表格数据)组成的结构化数据集。通过表格,你可以快速轻松地查找指示不同类型数据之间某种联系的值,例如人员及其年龄、一周中的某一天或当地游泳池的时间表。
¥A table is a structured set of data made up of rows and columns (tabular data). A table allows you to quickly and easily look up values that indicate some kind of connection between different types of data, for example a person and their age, or a day of the week, or the timetable for a local swimming pool.

表格在人类社会中非常常用,并且已经使用了很长一段时间,这份 1800 年的美国人口普查文件就证明了这一点:
¥Tables are very commonly used in human society, and have been for a long time, as evidenced by this US Census document from 1800:
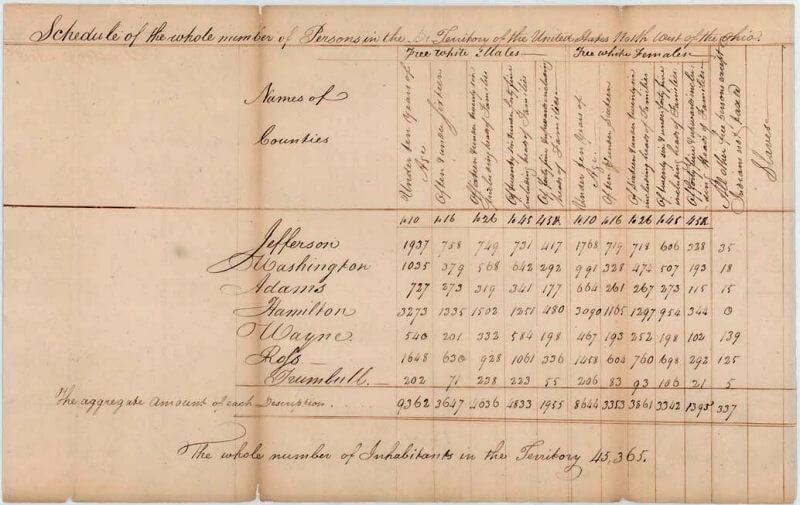
因此,难怪 HTML 的创建者提供了一种在 Web 上构建和呈现表格数据的方法。
¥It is therefore no wonder that the creators of HTML provided a means by which to structure and present tabular data on the web.
表如何工作?
¥How does a table work?
表格的要点在于它是刚性的。通过在行标题和列标题之间建立视觉关联,可以轻松地解释信息。例如,请查看下表,找到一颗拥有 62 个卫星的木星气态巨行星。你可以通过关联相关的行标题和列标题来找到答案。
¥The point of a table is that it is rigid. Information is easily interpreted by making visual associations between row and column headers. Look at the table below for example and find a Jovian gas giant with 62 moons. You can find the answer by associating the relevant row and column headers.
<table>
  <caption>
    Data about the planets of our solar system (Source:
    <a href="https://nssdc.gsfc.nasa.gov/planetary/factsheet/"
      >美国宇航局的行星情况说明书 - 公制</a
    >).
  </caption>
  <thead>
    <tr>
      <td colspan="2"></td>
      <th scope="col">名称</th>
      <th scope="col">质量(10<sup>24</sup>kg)</th>
      <th scope="col">直径(公里)</th>
      <th scope="col">密度(kg/m<sup>3</sup>)</th>
      <th scope="col">重力(米/秒<sup>2</sup>)</th>
      <th scope="col">一天的长度(小时)</th>
      <th scope="col">距太阳的距离(10<sup>6</sup>公里)</th>
      <th scope="col">平均温度(°C)</th>
      <th scope="col">卫星数量</th>
      <th scope="col">注意</th>
    </tr>
  </thead>
  <tbody>
    <tr>
      <th colspan="2" rowspan="4" scope="rowgroup">类地行星</th>
      <th scope="row">汞</th>
      <td>0.330</td>
      <td>4,879</td>
      <td>5427</td>
      <td>3.7</td>
      <td>4222.6</td>
      <td>57.9</td>
      <td>167</td>
      <td>0</td>
      <td>距离太阳最近的地方</td>
    </tr>
    <tr>
      <th scope="row">金星</th>
      <td>4.87</td>
      <td>12,104</td>
      <td>5243</td>
      <td>8.9</td>
      <td>2802.0</td>
      <td>108.2</td>
      <td>464</td>
      <td>0</td>
      <td></td>
    </tr>
    <tr>
      <th scope="row">地球</th>
      <td>5.97</td>
      <td>12,756</td>
      <td>5514</td>
      <td>9.8</td>
      <td>24.0</td>
      <td>149.6</td>
      <td>15</td>
      <td>1</td>
      <td>我们的世界</td>
    </tr>
    <tr>
      <th scope="row">火星</th>
      <td>0.642</td>
      <td>6,792</td>
      <td>3933</td>
      <td>3.7</td>
      <td>24.7</td>
      <td>227.9</td>
      <td>-65</td>
      <td>2</td>
      <td>红色星球</td>
    </tr>
    <tr>
      <th rowspan="4" scope="rowgroup">木星行星</th>
      <th rowspan="2" scope="rowgroup">气态巨行星</th>
      <th scope="row">木星</th>
      <td>1898</td>
      <td>142,984</td>
      <td>1326</td>
      <td>23.1</td>
      <td>9.9</td>
      <td>778.6</td>
      <td>-110</td>
      <td>67</td>
      <td>最大的行星</td>
    </tr>
    <tr>
      <th scope="row">土星</th>
      <td>568</td>
      <td>120,536</td>
      <td>687</td>
      <td>9.0</td>
      <td>10.7</td>
      <td>1433.5</td>
      <td>-140</td>
      <td>62</td>
      <td></td>
    </tr>
    <tr>
      <th rowspan="2" scope="rowgroup">冰巨人</th>
      <th scope="row">天王星</th>
      <td>86.8</td>
      <td>51,118</td>
      <td>1271</td>
      <td>8.7</td>
      <td>17.2</td>
      <td>2872.5</td>
      <td>-195</td>
      <td>27</td>
      <td></td>
    </tr>
    <tr>
      <th scope="row">海王星</th>
      <td>102</td>
      <td>49,528</td>
      <td>1638</td>
      <td>11.0</td>
      <td>16.1</td>
      <td>4495.1</td>
      <td>-200</td>
      <td>14</td>
      <td></td>
    </tr>
    <tr>
      <th colspan="2" scope="rowgroup">矮行星</th>
      <th scope="row">冥王星</th>
      <td>0.0146</td>
      <td>2,370</td>
      <td>2095</td>
      <td>0.7</td>
      <td>153.3</td>
      <td>5906.4</td>
      <td>-225</td>
      <td>5</td>
      <td>
        2006 年被解密为行星,但这颗
        <a
          href="https://www.usatoday.com/story/tech/2014/10/02/pluto-planet-solar-system/16578959/"
          >仍有争议</a
        >.
      </td>
    </tr>
  </tbody>
</table>
table {
  border-collapse: collapse;
  border: 2px solid black;
}

th,
td {
  padding: 5px;
  border: 1px solid black;
}
如果实现正确,HTML 表格可以通过屏幕阅读器等辅助工具很好地处理,因此成功的 HTML 表格应该能够增强视力正常和视障用户的体验。
¥When implemented correctly, HTML tables are handled well by accessibility tools such as screen readers, so a successful HTML table should enhance the experience of sighted and visually impaired users alike.
表格样式
¥Table styling
你还可以在 GitHub 上拥有 看看活生生的例子!你会注意到的一件事是,该表格看起来确实更具可读性 - 这是因为你在此页面上看到的表格具有最少的样式,而 GitHub 版本应用了更重要的 CSS。
¥You can also have a look at the live example on GitHub! One thing you'll notice is that the table does look a bit more readable there — this is because the table you see above on this page has minimal styling, whereas the GitHub version has more significant CSS applied.
不要抱任何幻想;为了使表格在网络上有效,你需要使用 CSS 提供一些样式信息,以及使用 HTML 提供良好的实体结构。在本模块中,我们重点关注 HTML 部分;要了解 CSS 部分,你应该在完成此处后访问我们的 样式表 文章。
¥Be under no illusion; for tables to be effective on the web, you need to provide some styling information with CSS, as well as good solid structure with HTML. In this module we are focusing on the HTML part; to find out about the CSS part you should visit our Styling tables article after you've finished here.
我们不会在本模块中关注 CSS,但我们提供了一个最小的 CSS 样式表供你使用,这将使你的表格比没有任何样式的默认表格更具可读性。你可以找到 样式表在这里,也可以找到应用样式表的 HTML 模板 — 这些将为你试验 HTML 表格提供一个良好的起点。
¥We won't focus on CSS in this module, but we have provided a minimal CSS stylesheet for you to use that will make your tables more readable than the default you get without any styling. You can find the stylesheet here, and you can also find an HTML template that applies the stylesheet — these together will give you a good starting point for experimenting with HTML tables.
什么时候不应该使用 HTML 表格?
¥When should you NOT use HTML tables?
HTML 表格应该用于表格数据 - 这就是它们的设计目的。不幸的是,很多人过去使用 HTML 表格来布局网页,例如 一行包含标题,一行包含内容列,一行包含页脚等。你可以在我们的 无障碍学习模块 中的 页面布局 中找到更多详细信息和示例。这种方式之所以被广泛使用,是因为过去跨浏览器的 CSS 支持很糟糕。如今,表格布局已经不太常见了,但你可能仍然会在网络的某些角落看到它们。
¥HTML tables should be used for tabular data — this is what they are designed for. Unfortunately, a lot of people used to use HTML tables to lay out web pages, e.g. one row to contain the header, one row to contain the content columns, one row to contain the footer, etc. You can find more details and an example at Page Layouts in our Accessibility Learning Module. This was commonly used because CSS support across browsers used to be terrible; table layouts are much less common nowadays, but you might still see them in some corners of the web.
简而言之,使用表格而不是 CSS 布局技术 进行布局是一个坏主意。主要原因如下:
¥In short, using tables for layout rather than CSS layout techniques is a bad idea. The main reasons are as follows:
- 布局表降低了视障用户的可访问性:屏幕阅读器,由盲人使用,解释 HTML 页面中存在的标签并向用户读出内容。由于表格不是正确的布局工具,并且标记比 CSS 布局技术更复杂,因此屏幕阅读器的输出会让用户感到困惑。
- 表产生标签汤:如上所述,表布局通常涉及比正确的布局技术更复杂的标记结构。这可能会导致代码更难编写、维护和调试。
- 表不会自动响应:当你使用正确的布局容器(例如
<header>、<section>、<article>或<div>)时,它们的宽度默认为其父元素的 100%。另一方面,默认情况下,表格的大小根据其内容进行调整,因此需要采取额外的措施来使表格布局样式能够在各种设备上有效地工作。
主动学习:创建你的第一个表
¥Active learning: Creating your first table
我们已经足够讨论表格理论了,所以,让我们深入研究一个实际示例并构建一个简单的表格。
¥We've talked table theory enough, so, let's dive into a practical example and build up a simple table.
- 首先,在本地计算机上的新目录中制作 blank-template.html 和 minimal-table.css 的本地副本。
- 每个表的内容都包含在这两个标签中:
<table></table>。将它们添加到 HTML 正文中。 - 表内最小的容器是表单元格,它由
<td>元素('td' 代表 '表数据')创建。在表格标签中添加以下内容:html<td>Hi, I'm your first cell.</td> - 如果我们想要一行四个单元格,我们需要将这些标签复制三次。更新表的内容,如下所示:
html
<td>Hi, I'm your first cell.</td>
<td>I'm your second cell.</td>
<td>I'm your third cell.</td>
<td>I'm your fourth cell.</td>
正如你将看到的,单元格不是放置在彼此下方,而是自动在同一行上彼此对齐。每个 <td> 元素创建一个单元格,它们一起构成第一行。我们添加的每个单元格都会使行变得更长。
¥As you will see, the cells are not placed underneath each other, rather they are automatically aligned with each other on the same row. Each <td> element creates a single cell and together they make up the first row. Every cell we add makes the row grow longer.
为了阻止该行增长并开始将后续单元格放置在第二行上,我们需要使用 <tr> 元素('tr' 代表 '表行')。现在我们来调查一下。
¥To stop this row from growing and start placing subsequent cells on a second row, we need to use the <tr> element ('tr' stands for 'table row'). Let's investigate this now.
- 将你已经创建的四个单元格放入
<tr>标签内,如下所示:html<tr> <td>Hi, I'm your first cell.</td> <td>I'm your second cell.</td> <td>I'm your third cell.</td> <td>I'm your fourth cell.</td> </tr> - 现在你已经创建了一行,尝试再创建一两行 - 每行需要包含在一个额外的
<tr>元素中,每个单元格包含在<td>中。
结果
¥Result
这应该会产生如下所示的表:
¥This should result in a table that looks something like the following:
<table>
  <tr>
    <td>你好,我是你的第一个单元格。</td>
    <td>我是你的第二个单元格。</td>
    <td>我是你的第三个单元格。</td>
    <td>我是你的第四个单元格。</td>
  </tr>

  <tr>
    <td>第二行,第一个单元格。</td>
    <td>单元格 2。</td>
    <td>单元格 3。</td>
    <td>单元格 4。</td>
  </tr>
</table>
table {
  border-collapse: collapse;
}
td,
th {
  border: 1px solid black;
  padding: 10px 20px;
}
注意:你还可以在 GitHub 上找到此内容,代码为 simple-table.html (也看到它直播)。
¥Note: You can also find this on GitHub as simple-table.html (see it live also).
使用 <th> 元素添加标头
¥Adding headers with <th> elements
现在让我们将注意力转向表格标题 - 位于行或列开头的特殊单元格,用于定义行或列包含的数据类型(作为示例,请参阅第一个示例中的 "人" 和 "年龄" 单元格) 文章)。为了说明它们为何有用,请查看下表示例。首先是源码:
¥Now let's turn our attention to table headers — special cells that go at the start of a row or column and define the type of data that row or column contains (as an example, see the "Person" and "Age" cells in the first example shown in this article). To illustrate why they are useful, have a look at the following table example. First the source code:
<table>
  <tr>
    <td></td>
    <td>诺基</td>
    <td>弗洛尔</td>
    <td>艾拉</td>
    <td>胡安</td>
  </tr>
  <tr>
    <td>品种</td>
    <td>杰克·拉塞尔</td>
    <td>贵宾犬</td>
    <td>街头狗</td>
    <td>可卡犬</td>
  </tr>
  <tr>
    <td>年龄</td>
    <td>16</td>
    <td>9</td>
    <td>10</td>
    <td>5</td>
  </tr>
  <tr>
    <td>所有者</td>
    <td>岳母</td>
    <td>我</td>
    <td>我</td>
    <td>嫂子</td>
  </tr>
  <tr>
    <td>饮食习惯</td>
    <td>吃掉大家的剩菜</td>
    <td>啃咬食物</td>
    <td>吃得饱饱的</td>
    <td>会吃到爆炸</td>
  </tr>
</table>
table {
  border-collapse: collapse;
}
td,
th {
  border: 1px solid black;
  padding: 10px 20px;
}
现在实际渲染的表:
¥Now the actual rendered table:
这里的问题是,虽然你可以了解正在发生的事情,但交叉引用数据并不那么容易。如果列标题和行标题以某种方式突出,那就更好了。
¥The problem here is that, while you can kind of make out what's going on, it is not as easy to cross reference data as it could be. If the column and row headings stood out in some way, it would be much better.
主动学习:表格标题
¥Active learning: table headers
让我们尝试改进这张表。
¥Let's have a go at improving this table.
- 首先,在本地计算机上的新目录中制作 dogs-table.html 和 minimal-table.css 文件的本地副本。HTML 包含与你在上面看到的相同的 Dogs 示例。
- 要将表标题在视觉上和语义上识别为标题,你可以使用
<th>元素('th' 代表 '表头')。它的工作方式与<td>完全相同,只是它表示标题,而不是普通单元格。进入 HTML,将表头周围的所有<td>元素更改为<th>元素。 - 保存 HTML 并将其加载到浏览器中,你应该看到标头现在看起来像标头。
注意:你可以在 GitHub 上的 dogs-table-fixed.html (也看到它直播) 找到我们完成的示例。
¥Note: You can find our finished example at dogs-table-fixed.html on GitHub (see it live also).
为什么标题有用?
¥Why are headers useful?
我们已经部分回答了这个问题 - 当标题明显突出时,更容易找到你正在寻找的数据,并且设计通常看起来更好。
¥We have already partially answered this question — it is easier to find the data you are looking for when the headers clearly stand out, and the design just generally looks better.
注意:表格标题带有一些默认样式 - 即使你没有将自己的样式添加到表格中,它们也是粗体且居中的,以帮助它们脱颖而出。
¥Note: Table headings come with some default styling — they are bold and centered even if you don't add your own styling to the table, to help them stand out.
表格标题还有一个额外的好处 - 与 scope 属性(我们将在下一篇文章中了解)一起,它们允许你通过将每个标题与同一行或同一列中的所有数据相关联来使表格更易于访问。然后,屏幕阅读器可以一次读出整行或整列的数据,这非常有用。
¥Tables headers also have an added benefit — along with the scope attribute (which we'll learn about in the next article), they allow you to make tables more accessible by associating each header with all the data in the same row or column. Screen readers are then able to read out a whole row or column of data at once, which is pretty useful.
允许单元格跨越多行和多列
¥Allowing cells to span multiple rows and columns
有时我们希望单元格跨越多行或多列。举个简单的例子,它显示了常见动物的名称。在某些情况下,我们希望在动物名称旁边显示雄性和雌性的名称。有时我们不这样做,在这种情况下,我们只想让动物名称遍布整个表格。
¥Sometimes we want cells to span multiple rows or columns. Take the following simple example, which shows the names of common animals. In some cases, we want to show the names of the males and females next to the animal name. Sometimes we don't, and in such cases we just want the animal name to span the whole table.
初始标记如下所示:
¥The initial markup looks like this:
<table>
  <tr>
    <th>动物</th>
  </tr>
  <tr>
    <th>河马</th>
  </tr>
  <tr>
    <th>马</th>
    <td>马雷</td>
  </tr>
  <tr>
    <td>骘</td>
  </tr>
  <tr>
    <th>鳄鱼</th>
  </tr>
  <tr>
    <th>鸡</th>
    <td>母鸡</td>
  </tr>
  <tr>
    <td>公鸡</td>
  </tr>
</table>
table {
  border-collapse: collapse;
}
td,
th {
  border: 1px solid black;
  padding: 10px 20px;
}
但输出并没有给我们想要的结果:
¥But the output doesn't give us quite what we want:
我们需要一种方法让 "动物"、"河马" 和 "鳄鱼" 跨越两列,让 "马" 和 "鸡" 向下跨越两行。幸运的是,表格标题和单元格具有 colspan 和 rowspan 属性,这使我们能够执行这些操作。两者都接受无单位数值,该数值等于你想要跨越的行数或列数。例如,colspan="2" 使单元格跨越两列。
¥We need a way to get "Animals", "Hippopotamus", and "Crocodile" to span across two columns, and "Horse" and "Chicken" to span downwards over two rows. Fortunately, table headers and cells have the colspan and rowspan attributes, which allow us to do just those things. Both accept a unitless number value, which equals the number of rows or columns you want spanned. For example, colspan="2" makes a cell span two columns.
让我们使用 colspan 和 rowspan 来改进这个表。
¥Let's use colspan and rowspan to improve this table.
- 首先,在本地计算机上的新目录中制作 animals-table.html 和 minimal-table.css 文件的本地副本。HTML 包含与你在上面看到的相同的动物示例。
- 接下来,使用
colspan使 "动物"、"河马" 和 "鳄鱼" 跨越两列。 - 最后,使用
rowspan使 "马" 和 "鸡" 跨越两行。 - 保存并在浏览器中打开代码以查看改进。
注意:你可以在 GitHub 上的 animals-table-fixed.html (也看到它直播) 找到我们完成的示例。
¥Note: You can find our finished example at animals-table-fixed.html on GitHub (see it live also).
为列提供通用样式
没有样式 <col>
¥Styling without <col>
在继续之前,我们将在本文中介绍最后一项功能。HTML 有一种方法可以在一个地方(<col> 和 <colgroup> 元素)定义整列数据的样式信息。之所以存在这些,是因为在列上指定样式可能有点烦人且效率低下 - 你通常必须在列中的每个 <td> 或 <th> 上指定样式信息,或者使用复杂的选择器(例如 :nth-child)。
¥There is one last feature we'll tell you about in this article before we move on. HTML has a method of defining styling information for an entire column of data all in one place — the <col> and <colgroup> elements. These exist because it can be a bit annoying and inefficient having to specify styling on columns — you generally have to specify your styling information on every <td> or <th> in the column, or use a complex selector such as :nth-child.
注意:像这样设置列的样式是 仅限于少数属性:
border、background、width和visibility。要设置其他属性,你必须为列中的每个<td>或<th>设置样式,或者使用复杂的选择器(例如:nth-child)。¥Note: Styling columns like this is limited to a few properties:
border,background,width, andvisibility. To set other properties you'll have to either style every<td>or<th>in the column, or use a complex selector such as:nth-child.
举个简单的例子:
¥Take the following simple example:
<table>
  <tr>
    <th>数据 1</th>
    <th style="background-color: yellow">数据 2</th>
  </tr>
  <tr>
    <td>加尔各答</td>
    <td style="background-color: yellow">橙子</td>
  </tr>
  <tr>
    <td>机器人</td>
    <td style="background-color: yellow">爵士乐</td>
  </tr>
</table>
table {
  border-collapse: collapse;
}
td,
th {
  border: 1px solid black;
  padding: 10px 20px;
}
这给了我们以下结果:
¥Which gives us the following result:
这并不理想,因为我们必须在列中的所有三个单元格中重复样式信息(我们可能在实际项目中的所有三个单元格上设置 class,并在单独的样式表中指定样式)。
¥This isn't ideal, as we have to repeat the styling information across all three cells in the column (we'd probably have a class set on all three in a real project and specify the styling in a separate stylesheet).
使用 <col> 进行样式设置
¥Styling with <col>
我们可以在 <col> 元素上指定一次信息,而不是这样做。<col> 元素在 <colgroup> 容器内指定,位于起始 <table> 标记下方。我们可以通过指定我们的表来创建与上面看到的相同的效果,如下所示:
¥Instead of doing this, we can specify the information once, on a <col> element. <col> elements are specified inside a <colgroup> container just below the opening <table> tag. We could create the same effect as we see above by specifying our table as follows:
<table>
  <colgroup>
    <col />
    <col style="background-color: yellow" />
  </colgroup>
  <tr>
    <th>数据 1</th>
    <th>数据 2</th>
  </tr>
  <tr>
    <td>加尔各答</td>
    <td>橙子</td>
  </tr>
  <tr>
    <td>机器人</td>
    <td>爵士乐</td>
  </tr>
</table>
实际上,我们定义了两个 "样式栏",一个指定每一列的样式信息。我们没有设置第一列的样式,但我们仍然必须包含一个空白的 <col> 元素 - 如果不这样做,样式将仅应用于第一列。
¥Effectively we are defining two "style columns", one specifying styling information for each column. We are not styling the first column, but we still have to include a blank <col> element — if we didn't, the styling would just be applied to the first column.
如果我们想将样式信息应用到两列,我们可以只包含一个带有 span 属性的 <col> 元素,如下所示:
¥If we wanted to apply the styling information to both columns, we could just include one <col> element with a span attribute on it, like this:
<colgroup>
  <col style="background-color: yellow" span="2" />
</colgroup>
就像 colspan 和 rowspan 一样,span 采用无单位数值,指定要应用样式的列数。
¥Just like colspan and rowspan, span takes a unitless number value that specifies the number of columns you want the styling to apply to.
注意:当表格、列以及该列中的表格单元格都单独设置样式时,应用于单元格的样式将绘制在绘制在表格顶部的列样式的顶部。这是因为首先渲染表格层,然后渲染列层,其中 单元格层呈现在所有其他表格层之上。
¥Note: When the table, a column, and table cells in that column are all styled separately then styles applied to the cells are painted on top of column styles which are painted on top of the table. This is because the table layer is rendered first, then the columns' layer is rendered, with the cells' layer rendered on top of all the other table layers.
主动学习:科尔基和科尔
¥Active learning: colgroup and col
现在是时候亲自尝试一下了。
¥Now it's time to have a go yourself.
下面你可以看到语言老师的时间表。周五她有一个新的课程,全天教授荷兰语,但她也在周二和周四教授几节德语。她想高亮包含她正在教学的日子的列。
¥Below you can see the timetable of a languages teacher. On Friday she has a new class teaching Dutch all day, but she also teaches German for a few periods on Tuesday and Thursdays. She wants to highlight the columns containing the days she is teaching.
按照以下步骤重新创建表。
¥Recreate the table by following the steps below.
- 首先,在本地计算机上的新目录中制作 timetable.html 文件的本地副本。HTML 包含你在上面看到的相同表格,但减去了列样式信息。
- 在表格顶部、
<table>标签下方添加<colgroup>元素,你可以在其中添加<col>元素(请参阅下面的剩余步骤)。 - 前两列需要保持无样式。
- 向第三列添加背景颜色。你的
style属性的值为background-color:#97DB9A; - 在第四列上设置单独的宽度。你的
style属性的值为width: 42px; - 向第五列添加背景颜色。你的
style属性的值为background-color: #97DB9A; - 在第六列添加不同的背景颜色和边框,以表示这是一个特殊的日子,她正在教一个新课程。你的
style属性的值为background-color:#DCC48E; border:4px solid #C1437A; - 最后两天是自由日,所以只需将它们设置为没有背景颜色但设置宽度即可;
style属性的值为width: 42px;
看看你如何继续这个例子。如果你遇到困难,或者想检查你的工作,你可以在 GitHub 上找到我们的版本:timetable-fixed.html (也看到它直播)。
¥See how you get on with the example. If you get stuck, or want to check your work, you can find our version on GitHub as timetable-fixed.html (see it live also).
概括
¥Summary
这差不多涵盖了 HTML 表格的基础知识。在下一篇文章中,我们将研究一些稍微多一点的 高级表功能,并开始思考它们对于视障人士来说有多容易理解。
¥That just about wraps up the basics of HTML tables. In the next article, we'll look at some slightly more advanced table features, and start to think how accessible they are for visually impaired people.