绘制图形
该浏览器包含一些非常强大的图形编程工具,从可扩展矢量图形 (SVG) 语言到用于在 HTML <canvas> 元素上绘图的 API(请参阅 画布 API 和 WebGL)。本文提供了画布的介绍以及更多资源,以便你了解更多信息。
¥The browser contains some very powerful graphics programming tools, from the Scalable Vector Graphics (SVG) language, to APIs for drawing on HTML <canvas> elements, (see The Canvas API and WebGL). This article provides an introduction to canvas, and further resources to allow you to learn more.
| 先决条件: | JavaScript 基础知识(参见 第一步、 架构模块、 JavaScript 对象)、 客户端 API 基础知识 |
|---|---|
| 目标: | 了解使用 JavaScript 在 <canvas> 元素上绘图的基础知识。 |
网络上的图形
¥Graphics on the Web
正如我们在 HTML 多媒体和嵌入 模块中讨论的那样,Web 最初只是文本,这非常无聊,因此引入了图片 - 首先通过 <img> 元素,后来通过 CSS 属性(例如 background-image 和 SVG)。
¥As we talked about in our HTML Multimedia and embedding module, the Web was originally just text, which was very boring, so images were introduced — first via the <img> element and later via CSS properties such as background-image, and SVG.
然而这还不够。虽然你可以使用 CSS 和 JavaScript 来制作动画(或以其他方式操作)SVG 矢量图片(因为它们由标记表示),但仍然无法对位图图片执行相同的操作,并且可用的工具相当有限。Web 仍然无法有效地创建动画、游戏、3D 场景以及通常由 C++ 或 Java 等较底层语言处理的其他需求。
¥This however was still not enough. While you could use CSS and JavaScript to animate (and otherwise manipulate) SVG vector images — as they are represented by markup — there was still no way to do the same for bitmap images, and the tools available were rather limited. The Web still had no way to effectively create animations, games, 3D scenes, and other requirements commonly handled by lower level languages such as C++ or Java.
当浏览器在 2004 年开始支持 <canvas> 元素和相关的 画布 API 时,情况开始有所改善。正如你将在下面看到的,canvas 提供了一些有用的工具来创建 2D 动画、游戏、数据可视化和其他类型的应用,特别是与 Web 平台提供的一些其他 API 结合使用时,但可能很难或不可能制作 无障碍
¥The situation started to improve when browsers began to support the <canvas> element and associated Canvas API in 2004. As you'll see below, canvas provides some useful tools for creating 2D animations, games, data visualizations, and other types of applications, especially when combined with some of the other APIs the web platform provides, but can be difficult or impossible to make accessible
下面的示例显示了一个简单的基于画布的 2D 弹跳球动画,我们最初是在 JavaScript 对象介绍 模块中遇到的:
¥The below example shows a simple 2D canvas-based bouncing balls animation that we originally met in our Introducing JavaScript objects module:
2006 年至 2007 年左右,Mozilla 开始实现实验性 3D 画布。这就是 WebGL,它受到了浏览器供应商的关注,并在 2009 年至 2010 年左右实现了标准化。WebGL 允许你在网络浏览器中创建真实的 3D 图形;下面的示例显示了一个简单的旋转 WebGL 立方体:
¥Around 2006–2007, Mozilla started work on an experimental 3D canvas implementation. This became WebGL, which gained traction among browser vendors, and was standardized around 2009–2010. WebGL allows you to create real 3D graphics inside your web browser; the below example shows a simple rotating WebGL cube:
本文将主要关注 2D 画布,因为原始 WebGL 代码非常复杂。不过,我们将展示如何使用 WebGL 库更轻松地创建 3D 场景,并且你可以在其他地方找到涵盖原始 WebGL 的教程 - 请参阅 WebGL 入门。
¥This article will focus mainly on 2D canvas, as raw WebGL code is very complex. We will however show how to use a WebGL library to create a 3D scene more easily, and you can find a tutorial covering raw WebGL elsewhere — see Getting started with WebGL.
主动学习:开始使用 <canvas>
¥Active learning: Getting started with a <canvas>
如果要在网页上创建 2D 或 3D 场景,则需要从 HTML <canvas> 元素开始。该元素用于定义页面上将绘制图片的区域。这就像在页面上包含元素一样简单:
¥If you want to create a 2D or 3D scene on a web page, you need to start with an HTML <canvas> element. This element is used to define the area on the page into which the image will be drawn. This is as simple as including the element on the page:
<canvas width="320" height="240"></canvas>
这将在页面上创建一个大小为 320 x 240 像素的画布。
¥This will create a canvas on the page with a size of 320 by 240 pixels.
你应该在 <canvas> 标签内放置一些后备内容。这应该向不支持画布的浏览器用户或屏幕阅读器用户描述画布内容。
¥You should put some fallback content inside the <canvas> tags. This should describe the canvas content to users of browsers that don't support canvas, or users of screen readers.
<canvas width="320" height="240">
  <p>Description of the canvas for those unable to view it.</p>
</canvas>
后备应该为画布内容提供有用的替代内容。例如,如果你要渲染不断更新的股票价格图表,则后备内容可能是最新股票图表的静态图片,其中 alt 文本说明文本中的价格或指向各个股票页面的链接列表。
¥The fallback should provide useful alternative content to the canvas content. For example, if you are rendering a constantly updating graph of stock prices, the fallback content could be a static image of the latest stock graph, with alt text saying what the prices are in text or a list of links to individual stock pages.
注意:屏幕阅读器无法访问画布内容。将描述性文本直接包含在画布元素本身上作为
aria-label属性的值,或者包含放置在开始和结束<canvas>标记内的后备内容。画布内容不是 DOM 的一部分,但嵌套后备内容是。¥Note: Canvas content is not accessible to screen readers. Include descriptive text as the value of the
aria-labelattribute directly on the canvas element itself or include fallback content placed within the opening and closing<canvas>tags. Canvas content is not part of the DOM, but nested fallback content is.
创建画布并调整其大小
¥Creating and sizing our canvas
让我们首先创建自己的画布,在上面绘制未来的实验。
¥Let's start by creating our own canvas that we draw future experiments on to.
- 首先制作 0_canvas_start 目录的本地副本。它包含三个文件:
- "index.html"
- "script.js"
- "style.css"
- 打开 "index.html",并将以下代码添加到其中,位于起始
<body>标记下方:我们在html<canvas class="myCanvas"> <p>Add suitable fallback here.</p> </canvas><canvas>元素中添加了class,这样如果页面上有多个画布,选择起来会更容易,但我们暂时删除了width和height属性(如果你愿意,你可以将它们添加回来,但我们会 在下面的部分中使用 JavaScript 设置它们)。没有明确宽度和高度的画布默认为 300 像素宽 x 150 像素高。 -
现在打开 "script.js" 并添加以下 JavaScript 行:
这里我们在js
const canvas = document.querySelector(".myCanvas"); const width = (canvas.width = window.innerWidth); const height = (canvas.height = window.innerHeight);canvas常量中存储了对画布的引用。在第二行中,我们将新常量width和画布的width属性设置为等于Window.innerWidth(这为我们提供了视口宽度)。在第三行中,我们将新常量height和画布的height属性设置为等于Window.innerHeight(这为我们提供了视口高度)。现在我们有了一个填充浏览器窗口整个宽度和高度的画布! 你还会看到,我们将赋值与多个等号链接在一起 - 这在 JavaScript 中是允许的,如果你想让多个变量都等于相同的值,那么这是一个很好的技术。我们希望在宽度/高度变量中轻松访问画布的宽度和高度,因为它们是稍后可用的有用值(例如,如果你想在画布宽度的一半处绘制某些内容)。
注意:你通常应该使用 HTML 属性或 DOM 属性设置图片的大小,如上所述。你可以使用 CSS,但问题是尺寸调整是在画布渲染后完成的,就像任何其他图片(渲染的画布只是一个图片)一样,图片可能会像素化/扭曲。
¥Note: You should generally set the size of the image using HTML attributes or DOM properties, as explained above. You could use CSS, but the trouble then is that the sizing is done after the canvas has rendered, and just like any other image (the rendered canvas is just an image), the image could become pixelated/distorted.
获取画布上下文和最终设置
¥Getting the canvas context and final setup
在我们认为画布模板完成之前,我们需要做最后一件事。为了在画布上绘图,我们需要获得对绘图区域的特殊引用,称为上下文。这是使用 HTMLCanvasElement.getContext() 方法完成的,该方法的基本用法是将单个字符串作为表示要检索的上下文类型的参数。
¥We need to do one final thing before we can consider our canvas template finished. To draw onto the canvas we need to get a special reference to the drawing area called a context. This is done using the HTMLCanvasElement.getContext() method, which for basic usage takes a single string as a parameter representing the type of context you want to retrieve.
在本例中,我们需要一个 2d 画布,因此将以下 JavaScript 行添加到 "script.js" 中其他行的下方:
¥In this case we want a 2d canvas, so add the following JavaScript line below the others in "script.js":
const ctx = canvas.getContext("2d");
注意:你可以选择的其他上下文值包括用于 WebGL 的
webgl、用于 WebGL 2 的webgl2等,但我们在本文中不需要这些值。¥Note: other context values you could choose include
webglfor WebGL,webgl2for WebGL 2, etc., but we won't need those in this article.
就是这样 - 我们的画布现在已经准备好,可以在上面绘图了!ctx 变量现在包含一个 CanvasRenderingContext2D 对象,画布上的所有绘图操作都将涉及操作该对象。
¥So that's it — our canvas is now primed and ready for drawing on! The ctx variable now contains a CanvasRenderingContext2D object, and all drawing operations on the canvas will involve manipulating this object.
在我们继续之前,让我们做最后一件事。我们将画布背景设置为黑色,以便你初步体验画布 API。在 JavaScript 底部添加以下行:
¥Let's do one last thing before we move on. We'll color the canvas background black to give you a first taste of the canvas API. Add the following lines at the bottom of your JavaScript:
ctx.fillStyle = "rgb(0 0 0)";
ctx.fillRect(0, 0, width, height);
这里我们使用画布的 fillStyle 属性设置填充颜色(这需要 颜色值 就像 CSS 属性一样),然后使用 fillRect 方法绘制一个覆盖整个画布区域的矩形(前两个参数是画布的坐标) 矩形的左上角;最后两个是你想要绘制矩形的宽度和高度 - 我们告诉过你那些 width 和 height 变量会很有用)!
¥Here we are setting a fill color using the canvas' fillStyle property (this takes color values just like CSS properties do), then drawing a rectangle that covers the entire area of the canvas with the fillRect method (the first two parameters are the coordinates of the rectangle's top left-hand corner; the last two are the width and height you want the rectangle drawn at — we told you those width and height variables would be useful)!
好的,我们的模板已经完成,是时候继续了。
¥OK, our template is done and it's time to move on.
2D 画布基础知识
¥2D canvas basics
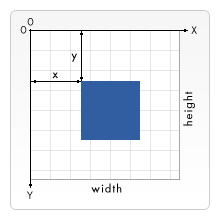
正如我们上面所说,所有绘图操作都是通过操作 CanvasRenderingContext2D 对象(在我们的例子中为 ctx)来完成的。许多操作需要给定坐标来精确定位要绘制内容的位置 - 画布的左上角是点 (0, 0),水平 (x) 轴从左到右,垂直 (y) 轴从 从上到下。
¥As we said above, all drawing operations are done by manipulating a CanvasRenderingContext2D object (in our case, ctx). Many operations need to be given coordinates to pinpoint exactly where to draw something — the top left of the canvas is point (0, 0), the horizontal (x) axis runs from left to right, and the vertical (y) axis runs from top to bottom.
绘制形状往往是使用矩形形状基元来完成,或者沿着特定路径绘制一条线,然后填充形状。下面我们将展示如何做到这两点。
¥Drawing shapes tends to be done using the rectangle shape primitive, or by tracing a line along a certain path and then filling in the shape. Below we'll show how to do both.
简单的矩形
¥Simple rectangles
让我们从一些简单的矩形开始。
¥Let's start with some simple rectangles.
- 首先,复制新编码的画布模板(如果你没有执行上述步骤,则复制 1_canvas_template 目录的本地副本)。
- 接下来,将以下行添加到 JavaScript 的底部:
如果保存并刷新,你应该会看到画布上出现一个红色矩形。它的左上角距画布边缘的顶部和左侧 50 像素(由前两个参数定义),宽度为 100 像素,高度为 150 像素(由第三个和第四个参数定义)。js
ctx.fillStyle = "rgb(255 0 0)"; ctx.fillRect(50, 50, 100, 150); - 让我们添加另一个矩形到混合中 - 这次是绿色的。在 JavaScript 底部添加以下内容:
保存并刷新,你将看到新的矩形。这提出了一个重要的观点:图形操作(例如绘制矩形、线条等)按照它们发生的顺序执行。可以把它想象成粉刷一堵墙,每层油漆都是重叠的,甚至可能隐藏下面的东西。你无法做任何事情来改变这一点,因此你必须仔细考虑绘制图形的顺序。js
ctx.fillStyle = "rgb(0 255 0)"; ctx.fillRect(75, 75, 100, 100); - 请注意,你可以通过指定半透明颜色来绘制半透明图形,例如使用
rgb()。"阿尔法通道" 定义颜色的透明度。它的值越高,就越会掩盖其背后的内容。将以下内容添加到你的代码中:jsctx.fillStyle = "rgb(255 0 255 / 75%)"; ctx.fillRect(25, 100, 175, 50); - 现在尝试绘制更多自己的矩形;玩得开心!
笔画和线宽
¥Strokes and line widths
到目前为止,我们已经了解了绘制填充矩形,但你也可以绘制只是轮廓的矩形(在图形设计中称为笔画)。要设置描边的颜色,请使用 strokeStyle 属性;使用 strokeRect 绘制描边矩形。
¥So far we've looked at drawing filled rectangles, but you can also draw rectangles that are just outlines (called strokes in graphic design). To set the color you want for your stroke, you use the strokeStyle property; drawing a stroke rectangle is done using strokeRect.
- 将以下内容添加到前面的示例中,同样位于前面的 JavaScript 行下方:
js
ctx.strokeStyle = "rgb(255 255 255)"; ctx.strokeRect(25, 25, 175, 200); - 笔画的默认宽度为 1 像素;你可以调整
lineWidth属性值来更改此设置(它需要一个代表笔划宽度的像素数的数字)。在前两行之间添加以下行:jsctx.lineWidth = 5;
现在你应该看到你的白色轮廓变得更粗了!现在就这样。此时你的示例应如下所示:
¥Now you should see that your white outline has become much thicker! That's it for now. At this point your example should look like this:
注意:完成的代码可在 GitHub 上获取,编号为 2_canvas_rectangles。
¥Note: The finished code is available on GitHub as 2_canvas_rectangles.
绘制路径
¥Drawing paths
如果你想绘制比矩形更复杂的东西,你需要绘制一条路径。基本上,这涉及编写代码来准确指定笔应在画布上移动的路径,以追踪要绘制的形状。Canvas 包含绘制直线、圆、贝塞尔曲线等的功能。
¥If you want to draw anything more complex than a rectangle, you need to draw a path. Basically, this involves writing code to specify exactly what path the pen should move along on your canvas to trace the shape you want to draw. Canvas includes functions for drawing straight lines, circles, Bézier curves, and more.
让我们通过制作画布模板 (1_canvas_template) 的新副本来开始本节,在其中绘制新示例。
¥Let's start the section off by making a fresh copy of our canvas template (1_canvas_template), in which to draw the new example.
我们将在以下所有部分中使用一些常见的方法和属性:
¥We'll be using some common methods and properties across all of the below sections:
beginPath()— 从笔当前在画布上的位置开始绘制路径。在新画布上,笔从 (0, 0) 开始。moveTo()— 将笔移动到画布上的不同点,不记录或追踪线条;将笔 "jumps" 移动到新位置。fill()— 通过填充你到目前为止所描绘的路径来绘制一个填充形状。stroke()— 通过沿着你目前绘制的路径绘制笔划来绘制轮廓形状。- 你还可以将
lineWidth和fillStyle/strokeStyle等功能与路径和矩形一起使用。
典型的、简单的路径绘制操作如下所示:
¥A typical, simple path-drawing operation would look something like so:
ctx.fillStyle = "rgb(255 0 0)";
ctx.beginPath();
ctx.moveTo(50, 50);
// draw your path
ctx.fill();
画线
¥Drawing lines
让我们在画布上画一个等边三角形。
¥Let's draw an equilateral triangle on the canvas.
- 首先,将以下辅助函数添加到代码底部。这会将角度值转换为弧度,这很有用,因为每当你需要在 JavaScript 中提供角度值时,它几乎总是以弧度为单位,但人类通常以度为单位进行思考。
js
function degToRad(degrees) { return (degrees * Math.PI) / 180; } - 接下来,通过在之前添加的下方添加以下内容来开始你的路径;在这里,我们为三角形设置颜色,开始绘制路径,然后将笔移动到 (50, 50),而不绘制任何内容。这就是我们开始绘制三角形的地方。
js
ctx.fillStyle = "rgb(255 0 0)"; ctx.beginPath(); ctx.moveTo(50, 50); -
现在在脚本底部添加以下行:
让我们按顺序浏览一下: 首先,我们画一条线到 (150, 50) — 我们的路径现在沿着 x 轴向右移动 100 像素。 其次,我们使用一些简单的三角学来计算出等边三角形的高度。基本上,我们绘制的是向下的三角形。等边三角形的内角始终为 60 度;为了计算出高度,我们可以将其从中间分成两个直角三角形,每个直角三角形的角度分别为 90 度、60 度和 30 度。从侧面来看:js
ctx.lineTo(150, 50); const triHeight = 50 * Math.tan(degToRad(60)); ctx.lineTo(100, 50 + triHeight); ctx.lineTo(50, 50); ctx.fill();- 最长的边称为斜边
- 60 度角旁边的边称为相邻边,我们知道它是 50 像素,因为它是我们刚刚绘制的线的一半。
- 60 度角的对边称为对边,这就是我们要计算的三角形的高。

基本三角公式之一指出,相邻角的长度乘以角的正切等于相反数,因此我们得出 50 * Math.tan(degToRad(60))。我们使用 degToRad() 函数将 60 度转换为弧度,因为 Math.tan() 需要以弧度为单位的输入值。
¥One of the basic trigonometric formulae states that the length of the adjacent multiplied by the tangent of the angle is equal to the opposite, hence we come up with 50 * Math.tan(degToRad(60)). We use our degToRad() function to convert 60 degrees to radians, as Math.tan() expects an input value in radians.
- 计算出高度后,我们再画一条到
(100, 50 + triHeight)的线。X 坐标很简单;它必须是我们之前设置的两个 X 值的中间值。另一方面,Y 值必须是 50 加上三角形高度,因为我们知道三角形的顶部距画布顶部 50 像素。 - 下一行画一条线回到三角形的起点。
- 最后,我们运行
ctx.fill()来结束路径并填充形状。
画圆圈
¥Drawing circles
现在让我们看看如何在画布上绘制圆形。这是使用 arc() 方法完成的,该方法在指定点绘制全部或部分圆。
¥Now let's look at how to draw a circle in canvas. This is accomplished using the arc() method, which draws all or part of a circle at a specified point.
- 让我们在画布上添加一条弧线 - 将以下内容添加到代码底部:
js
ctx.fillStyle = "rgb(0 0 255)"; ctx.beginPath(); ctx.arc(150, 106, 50, degToRad(0), degToRad(360), false); ctx.fill();arc()有六个参数。前两个指定圆弧中心的位置(分别为 X 和 Y)。第三个是圆的半径,第四个和第五个是绘制圆的起始角度和结束角度(因此指定 0 度和 360 度即可得到一个完整的圆),第六个参数定义是否应逆时针绘制圆( 逆时针)或顺时针(false为顺时针)。注意:0 度是水平向右。
¥Note: 0 degrees is horizontally to the right.
- 让我们尝试添加另一个弧:
这里的模式非常相似,但有两个区别:js
ctx.fillStyle = "yellow"; ctx.beginPath(); ctx.arc(200, 106, 50, degToRad(-45), degToRad(45), true); ctx.lineTo(200, 106); ctx.fill();- 我们将
arc()的最后一个参数设置为true,意思是逆时针绘制圆弧,这意味着即使圆弧指定为从-45 度开始到 45 度结束,我们还是在 270 度周围而不是内部绘制圆弧 这部分。如果你将true更改为false,然后重新运行代码,则只会绘制圆的 90 度切片。 - 在调用
fill()之前,我们先画一条线到圆心。这意味着我们得到了相当漂亮的吃豆人风格的剪切图。如果你删除了这一行(尝试一下!),然后重新运行代码,你将得到在圆弧的起点和终点之间切掉的圆的边缘。这说明了画布的另一个重要点 - 如果你尝试填充不完整的路径(即未闭合的路径),浏览器会填充起点和终点之间的一条直线,然后将其填充。
- 我们将
现在就这样;你的最后一个例子应该是这样的:
¥That's it for now; your final example should look like this:
注意:完成的代码可在 GitHub 上获取,编号为 3_canvas_paths。
¥Note: The finished code is available on GitHub as 3_canvas_paths.
注意:要了解有关贝塞尔曲线等高级路径绘制功能的更多信息,请查看我们的 用画布绘制形状 教程。
¥Note: To find out more about advanced path drawing features such as Bézier curves, check out our Drawing shapes with canvas tutorial.
文本
¥Text
Canvas 还具有绘制文本的功能。让我们简要探讨一下这些。首先制作画布模板 (1_canvas_template) 的另一个新副本,在其中绘制新示例。
¥Canvas also has features for drawing text. Let's explore these briefly. Start by making another fresh copy of our canvas template (1_canvas_template) in which to draw the new example.
使用两种方法绘制文本:
¥Text is drawn using two methods:
fillText()— 绘制填充文本。strokeText()— 绘制轮廓(描边)文本。
这两者的基本用法都具有三个属性:要绘制的文本字符串以及开始绘制文本的点的 X 和 Y 坐标。这相当于文本框(字面意思是围绕你绘制的文本的框)的左下角,这可能会让你感到困惑,因为其他绘图操作往往从左上角开始 - 请记住这一点。
¥Both of these take three properties in their basic usage: the text string to draw and the X and Y coordinates of the point to start drawing the text at. This works out as the bottom left corner of the text box (literally, the box surrounding the text you draw), which might confuse you as other drawing operations tend to start from the top left corner — bear this in mind.
还有许多属性可以帮助控制文本呈现,例如 font,它允许你指定字体系列、大小等。它的值与 CSS font 属性的语法相同。
¥There are also a number of properties to help control text rendering such as font, which lets you specify font family, size, etc. It takes as its value the same syntax as the CSS font property.
屏幕阅读器无法访问画布内容。绘制到画布上的文本不可用于 DOM,但必须使其可供访问。在此示例中,我们将文本作为 aria-label 的值包含在内。
¥Canvas content is not accessible to screen readers. Text painted to the canvas is not available to the DOM, but must be made available to be accessible. In this example, we include the text as the value for aria-label.
尝试将以下块添加到 JavaScript 的底部:
¥Try adding the following block to the bottom of your JavaScript:
ctx.strokeStyle = "white";
ctx.lineWidth = 1;
ctx.font = "36px arial";
ctx.strokeText("Canvas text", 50, 50);

ctx.fillStyle = "red";
ctx.font = "48px georgia";
ctx.fillText("Canvas text", 50, 150);

canvas.setAttribute("aria-label", "Canvas text");
在这里,我们绘制两行文本,一行轮廓,另一行笔划。最后的例子应该是这样的:
¥Here we draw two lines of text, one outline and the other stroke. The final example should look like so:
注意:完成的代码可在 GitHub 上获取,编号为 4_canvas_text。
¥Note: The finished code is available on GitHub as 4_canvas_text.
玩一玩,看看你能想出什么!你可以在 绘图文字 找到有关画布文本可用选项的更多信息。
¥Have a play and see what you can come up with! You can find more information on the options available for canvas text at Drawing text.
将图片绘制到画布上
¥Drawing images onto canvas
可以将外部图片渲染到画布上。这些可以是简单的图片、视频帧或其他画布的内容。目前我们只看在画布上使用一些简单图片的情况。
¥It is possible to render external images onto your canvas. These can be simple images, frames from videos, or the content of other canvases. For the moment we'll just look at the case of using some simple images on our canvas.
-
和以前一样,制作画布模板 (1_canvas_template) 的另一个新副本,在其中绘制新示例。
使用
drawImage()方法将图片绘制到画布上。最简单的版本需要三个参数 - 对要渲染的图片的引用,以及图片左上角的 X 和 Y 坐标。 - 让我们首先将图片源嵌入到画布中。将以下行添加到 JavaScript 的底部:
这里我们使用js
const image = new Image(); image.src = "firefox.png";Image()构造函数创建一个新的HTMLImageElement对象。返回的对象与获取对现有<img>元素的引用时返回的对象类型相同。然后我们将其src属性设置为等于我们的 Firefox 徽标图片。此时,浏览器开始加载图片。 - 我们现在可以尝试使用
drawImage()嵌入图片,但我们需要确保首先加载图片文件,否则代码将失败。我们可以使用load事件来实现这一点,该事件仅在图片加载完成时才会被触发。在前一个块下面添加以下块:如果你现在在浏览器中加载示例,你应该会看到嵌入在画布中的图片。jsimage.addEventListener("load", () => ctx.drawImage(image, 20, 20)); - 但还有更多!如果我们只想显示图片的一部分或调整其大小怎么办?我们可以使用更复杂的
drawImage()版本来完成这两件事。像这样更新你的ctx.drawImage()行:jsctx.drawImage(image, 20, 20, 185, 175, 50, 50, 185, 175);- 和以前一样,第一个参数是图片参考。
- 参数 2 和 3 定义要从加载图片中剪切的区域的左上角相对于图片本身左上角的坐标。第一个参数左侧或第二个参数上方的任何内容都不会被绘制。
- 参数 4 和 5 定义我们要从加载的原始图片中剪切的区域的宽度和高度。
- 参数 6 和 7 定义要绘制图片剪切部分左上角相对于画布左上角的坐标。
- 参数 8 和 9 定义绘制图片剪切区域的宽度和高度。在本例中,我们指定了与原始切片相同的尺寸,但你可以通过指定不同的值来调整其大小。
- 当图片发生有意义的更新时,accessible description 也必须更新。
js
canvas.setAttribute("aria-label", "Firefox Logo");
最后的例子应该是这样的:
¥The final example should look like so:
注意:完成的代码可在 GitHub 上获取,编号为 5_canvas_images。
¥Note: The finished code is available on GitHub as 5_canvas_images.
循环和动画
¥Loops and animations
到目前为止,我们已经介绍了 2D 画布的一些非常基本的用法,但实际上,除非以某种方式更新画布或为其设置动画,否则你实际上无法体验画布的全部功能。毕竟,canvas 确实提供了可编写脚本的图片!如果你不打算更改任何内容,那么你不妨只使用静态图片并节省自己的所有工作。
¥We have so far covered some very basic uses of 2D canvas, but really you won't experience the full power of canvas unless you update or animate it in some way. After all, canvas does provide scriptable images! If you aren't going to change anything, then you might as well just use static images and save yourself all the work.
创建循环
¥Creating a loop
在画布中使用循环非常有趣 - 你可以像任何其他 JavaScript 代码一样在 for(或其他类型)循环内运行画布命令。
¥Playing with loops in canvas is rather fun — you can run canvas commands inside a for (or other type of) loop just like any other JavaScript code.
让我们构建一个简单的示例。
¥Let's build a simple example.
- 制作画布模板 (1_canvas_template) 的另一个新副本,然后在代码编辑器中将其打开。
- 将以下行添加到 JavaScript 的底部。其中包含一个新方法
translate(),它移动画布的原点:这会导致坐标原点 (0, 0) 移动到画布的中心,而不是位于左上角。这在许多情况下都非常有用,例如在这种情况下,我们希望相对于画布中心绘制设计。jsctx.translate(width / 2, height / 2); - 现在将以下代码添加到 JavaScript 的底部:
在这里,我们实现了与上面三角形示例中相同的js
function degToRad(degrees) { return (degrees * Math.PI) / 180; } function rand(min, max) { return Math.floor(Math.random() * (max - min + 1)) + min; } let length = 250; let moveOffset = 20; for (let i = 0; i < length; i++) {}degToRad()函数,一个rand()函数返回给定下限和上限之间的随机数,length和moveOffset变量(我们稍后会详细了解),以及一个空的for循环。 - 这里的想法是,我们将在
for循环内的画布上绘制一些内容,并每次对其进行迭代,以便我们可以创建一些有趣的内容。在for循环中添加以下代码:因此,在每次迭代中,我们:jsctx.fillStyle = `rgb(${255 - length} 0 ${255 - length} / 90%)`; ctx.beginPath(); ctx.moveTo(moveOffset, moveOffset); ctx.lineTo(moveOffset + length, moveOffset); const triHeight = (length / 2) * Math.tan(degToRad(60)); ctx.lineTo(moveOffset + length / 2, moveOffset + triHeight); ctx.lineTo(moveOffset, moveOffset); ctx.fill(); length--; moveOffset += 0.7; ctx.rotate(degToRad(5));- 将
fillStyle设置为稍微透明的紫色阴影,每次都会根据length的值而变化。正如你稍后将看到的,每次循环运行时长度都会变小,因此这里的效果是随着每个连续绘制的三角形颜色变得更亮。 - 开始路径。
- 将笔移动到
(moveOffset, moveOffset)坐标处;这个变量定义了每次绘制新三角形时我们想要移动多远。 - 画一条线到坐标
(moveOffset+length, moveOffset)。这将绘制一条平行于 X 轴、长度为length的线。 - 像以前一样计算三角形的高度。
- 画一条线到三角形的下角,然后画一条线回到三角形的起点。
- 调用
fill()来填充三角形。 - 更新描述三角形序列的变量,以便我们可以准备绘制下一个三角形。我们将
length值减 1,因此三角形每次都会变小;稍微增加moveOffset,使每个连续的三角形稍微远离一点,并使用另一个新函数rotate(),它允许我们旋转整个画布!在绘制下一个三角形之前,我们将其旋转 5 度。
- 将
就是这样!最后的例子应该是这样的:
¥That's it! The final example should look like so:
此时,我们鼓励你尝试一下该示例并使其成为你自己的示例!例如:
¥At this point, we'd like to encourage you to play with the example and make it your own! For example:
- 绘制矩形或圆弧而不是三角形,甚至嵌入图片。
- 使用
length和moveOffset值。 - 使用我们上面包含但未使用的
rand()函数引入一些随机数。
注意:完成的代码可在 GitHub 上获取,编号为 6_canvas_for_loop。
¥Note: The finished code is available on GitHub as 6_canvas_for_loop.
动画
¥Animations
我们上面构建的循环示例很有趣,但实际上你需要一个持续不断的循环,以适应任何严肃的画布应用(例如游戏和实时可视化)。如果你将画布想象成一部电影,那么你确实希望显示屏在每一帧上更新以显示更新后的视图,理想的刷新率为每秒 60 帧,以便人眼看起来运动流畅。
¥The loop example we built above was fun, but really you need a constant loop that keeps going and going for any serious canvas applications (such as games and real time visualizations). If you think of your canvas as being like a movie, you really want the display to update on each frame to show the updated view, with an ideal refresh rate of 60 frames per second so that movement appears nice and smooth to the human eye.
有一些 JavaScript 函数允许你每秒多次重复运行函数,对于我们的目的来说,最好的一个是 window.requestAnimationFrame()。它需要一个参数 - 你想要为每一帧运行的函数的名称。下次浏览器准备好更新屏幕时,你的函数将被调用。如果该函数将新的更新绘制到动画中,然后在函数结束之前再次调用 requestAnimationFrame(),则动画循环将继续运行。当你停止调用 requestAnimationFrame() 或在调用 requestAnimationFrame() 之后但在调用帧之前调用 window.cancelAnimationFrame() 时,循环结束。
¥There are a few JavaScript functions that will allow you to run functions repeatedly, several times a second, the best one for our purposes here being window.requestAnimationFrame(). It takes one parameter — the name of the function you want to run for each frame. The next time the browser is ready to update the screen, your function will get called. If that function draws the new update to your animation, then calls requestAnimationFrame() again just before the end of the function, the animation loop will continue to run. The loop ends when you stop calling requestAnimationFrame() or if you call window.cancelAnimationFrame() after calling requestAnimationFrame() but before the frame is called.
注意:使用完动画后,最好从主代码中调用
cancelAnimationFrame(),以确保没有任何更新仍在等待运行。¥Note: It's good practice to call
cancelAnimationFrame()from your main code when you're done using the animation, to ensure that no updates are still waiting to be run.
浏览器可以处理复杂的细节,例如使动画以一致的速度运行,并且不浪费资源来为看不到的东西设置动画。
¥The browser works out complex details such as making the animation run at a consistent speed, and not wasting resources animating things that can't be seen.
要了解它是如何工作的,让我们再次快速查看我们的弹跳球示例(现场观看,另请参阅 源代码)。保持一切移动的循环代码如下所示:
¥To see how it works, let's quickly look again at our Bouncing Balls example (see it live, and also see the source code). The code for the loop that keeps everything moving looks like this:
function loop() {
  ctx.fillStyle = "rgb(0 0 0 / 25%)";
  ctx.fillRect(0, 0, width, height);

  for (const ball of balls) {
    ball.draw();
    ball.update();
    ball.collisionDetect();
  }

  requestAnimationFrame(loop);
}

loop();
我们在代码底部运行一次 loop() 函数来开始循环,绘制第一个动画帧;然后 loop() 函数负责调用 requestAnimationFrame(loop) 来一次又一次地运行动画的下一帧。
¥We run the loop() function once at the bottom of the code to start the cycle, drawing the first animation frame; the loop() function then takes charge of calling requestAnimationFrame(loop) to run the next frame of the animation, again and again.
请注意,在每一帧上,我们都完全清除画布并重新绘制所有内容。对于每个存在的球,我们绘制它,更新它的位置,并检查它是否与任何其他球碰撞。一旦将图形绘制到画布上,就无法像使用 DOM 元素那样单独操作该图形。你无法在画布上移动每个球,因为一旦绘制它,它就成为画布的一部分,而不是单独的可访问元素或对象。相反,你必须擦除和重绘,要么擦除整个框架并重绘所有内容,要么使用代码准确地知道需要擦除哪些部分,并且仅擦除和重绘画布上所需的最小区域。
¥Note that on each frame we are completely clearing the canvas and redrawing everything. For every ball present we draw it, update its position, and check to see if it is colliding with any other balls. Once you've drawn a graphic to a canvas, there's no way to manipulate that graphic individually like you can with DOM elements. You can't move each ball around on the canvas, because once it's drawn, it's part of the canvas, and is not an individual accessible element or object. Instead, you have to erase and redraw, either by erasing the entire frame and redrawing everything, or by having code that knows exactly what parts need to be erased and only erases and redraws the minimum area of the canvas necessary.
优化图形动画是编程的一个专业,有许多巧妙的技术可用。不过,这些超出了我们示例所需的范围!
¥Optimizing animation of graphics is an entire specialty of programming, with lots of clever techniques available. Those are beyond what we need for our example, though!
一般来说,制作画布动画的过程包括以下步骤:
¥In general, the process of doing a canvas animation involves the following steps:
- 清除画布内容(例如使用
fillRect()或clearRect())。 - 使用
save()保存状态(如有必要) - 当你想要在继续之前保存在画布上更新的设置时,需要这样做,这对于更高级的应用很有用。 - 绘制要制作动画的图形。
- 使用
restore()恢复你在步骤 2 中保存的设置 - 调用
requestAnimationFrame()安排动画下一帧的绘制。
注意:我们不会在这里讨论
save()和restore(),但它们在我们的 转换 教程(及其后续教程)中得到了很好的解释。¥Note: We won't cover
save()andrestore()here, but they are explained nicely in our Transformations tutorial (and the ones that follow it).
一个简单的角色动画
¥A simple character animation
现在让我们创建自己的简单动画 - 我们将从某个相当棒的复古电脑游戏中获得一个角色在屏幕上行走。
¥Now let's create our own simple animation — we'll get a character from a certain rather awesome retro computer game to walk across the screen.
- 制作画布模板 (1_canvas_template) 的另一个新副本,然后在代码编辑器中将其打开。
- 更新内部 HTML 以反映图片:
html
<canvas class="myCanvas"> <p>A man walking.</p> </canvas> - 在 JavaScript 的底部,添加以下行,再次使坐标原点位于画布的中间:
js
ctx.translate(width / 2, height / 2); - 现在让我们创建一个新的
HTMLImageElement对象,将其src设置为我们要加载的图片,并添加一个onload事件处理程序,该处理程序将在加载图片时触发draw()函数:jsconst image = new Image(); image.src = "walk-right.png"; image.onload = draw; - 现在我们将添加一些变量来跟踪精灵在屏幕上绘制的位置以及我们想要显示的精灵编号。
让我们解释一下 spritesheet 图片(我们恭敬地从 Mike Thomas 的 使用 CSS 动画行走循环 CodePen 借用了它)。图片如下所示:js
let sprite = 0;
let posX = 0;
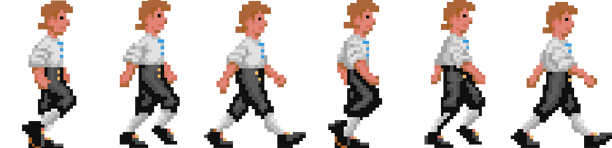
它包含六个精灵,组成了整个行走序列 - 每个精灵宽 102 像素,高 148 像素。为了干净地显示每个精灵,我们必须使用 drawImage() 从精灵表中截取单个精灵图片并仅显示该部分,就像我们上面对 Firefox 徽标所做的那样。切片的 X 坐标必须是 102 的倍数,Y 坐标始终为 0。切片大小始终为 102 x 148 像素。
¥It contains six sprites that make up the whole walking sequence — each one is 102 pixels wide and 148 pixels high. To display each sprite cleanly we will have to use drawImage() to chop out a single sprite image from the spritesheet and display only that part, like we did above with the Firefox logo. The X coordinate of the slice will have to be a multiple of 102, and the Y coordinate will always be 0. The slice size will always be 102 by 148 pixels.
- 现在让我们在代码底部插入一个空的
draw()函数,准备填充一些代码:jsfunction draw() {} - 本节中的其余代码位于
draw()内部。首先,添加以下行,清除画布以准备绘制每个帧。请注意,我们必须将矩形的左上角指定为-(width/2), -(height/2),因为我们之前将原点位置指定为width/2, height/2。jsctx.fillRect(-(width / 2), -(height / 2), width, height); - 接下来,我们将使用 drawImage(9 参数版本)绘制图片。添加以下内容:
如你看到的:js
ctx.drawImage(image, sprite * 102, 0, 102, 148, 0 + posX, -74, 102, 148);- 我们指定
image作为要嵌入的图片。 - 参数 2 和 3 指定要从源图片中剪切的切片的左上角,X 值为
sprite乘以 102(其中sprite是 0 到 5 之间的精灵编号),Y 值始终为 0。 - 参数 4 和 5 指定要剪切的切片的大小 — 102 像素 x 148 像素。
- 参数 6 和 7 指定在画布上绘制切片的框的左上角 - X 位置为 0 +
posX,这意味着我们可以通过更改posX值来更改绘制位置。 - 参数 8 和 9 指定画布上图片的大小。我们只是想保持其原始大小,因此我们指定 102 和 148 作为宽度和高度。
- 我们指定
-
现在,我们将在每次抽奖后更改
sprite值 - 好吧,无论如何,在其中一些抽奖之后。将以下块添加到draw()函数的底部:我们将整个块包裹在jsif (posX % 13 === 0) { if (sprite === 5) { sprite = 0; } else { sprite++; } }if (posX % 13 === 0) { }中。我们使用模 (%) 运算符(也称为 余数运算符)来检查posX值是否可以精确地除以 13 而没有余数。如果是这样,我们通过增加sprite来移动到下一个精灵(在完成精灵 #5 后换行到 0)。这实际上意味着我们仅每 13 帧更新一次精灵,或者大约每秒 5 帧(如果可能的话,requestAnimationFrame()以每秒 60 帧的速度调用我们)。我们故意降低帧速率,因为我们只有六个精灵可供使用,如果我们每 60 秒显示一个精灵,我们的角色就会移动得太快! 在外部块内,我们使用if...else语句来检查sprite值是否为 5(最后一个精灵,假设精灵编号从 0 到 5)。如果我们已经显示最后一个精灵,我们将sprite重置回 0;如果不是,我们只需将其增加 1。 -
接下来,我们需要弄清楚如何更改每一帧上的
posX值 - 在最后一帧的下方添加以下代码块。我们正在使用另一个jsif (posX > width / 2) { let newStartPos = -(width / 2 + 102); posX = Math.ceil(newStartPos); console.log(posX); } else { posX += 2; }if...else语句来查看posX的值是否大于width/2,这意味着我们的角色已经走出了屏幕的右边缘。如果是这样,我们计算一个位置,将角色放置在屏幕左侧的左侧。 如果我们的角色还没有走出屏幕边缘,我们将posX加 2。这将使我们下次绘制他时他向右移动一点。 - 最后,我们需要通过调用
draw()函数底部的requestAnimationFrame()来使动画循环:jswindow.requestAnimationFrame(draw);
就是这样!最后的例子应该是这样的:
¥That's it! The final example should look like so:
注意:完成的代码可在 GitHub 上获取,编号为 7_canvas_walking_animation。
¥Note: The finished code is available on GitHub as 7_canvas_walking_animation.
一个简单的绘图应用
¥A simple drawing application
作为最后一个动画示例,我们想向你展示一个非常简单的绘图应用,以说明如何将动画循环与用户输入(如本例中的鼠标移动)结合起来。我们不会让你走一遍并构建这个;我们将只探索代码中最有趣的部分。
¥As a final animation example, we'd like to show you a very simple drawing application, to illustrate how the animation loop can be combined with user input (like mouse movement, in this case). We won't get you to walk through and build this one; we'll just explore the most interesting parts of the code.
该示例可以在 GitHub 上找到,名称为 8_canvas_drawing_app,你可以在下面实时使用它:
¥The example can be found on GitHub as 8_canvas_drawing_app, and you can play with it live below:
让我们看看最有趣的部分。首先,我们使用三个变量来跟踪鼠标的 X 和 Y 坐标以及是否被单击:curX、curY 和 pressed。当鼠标移动时,我们会触发一个设置为 onmousemove 事件处理程序的函数,该函数捕获当前的 X 和 Y 值。我们还使用 onmousedown 和 onmouseup 事件处理程序在按下鼠标按钮时将 pressed 的值更改为 true,并在释放鼠标按钮时再次更改回 false。
¥Let's look at the most interesting parts. First of all, we keep track of the mouse's X and Y coordinates and whether it is being clicked or not with three variables: curX, curY, and pressed. When the mouse moves, we fire a function set as the onmousemove event handler, which captures the current X and Y values. We also use onmousedown and onmouseup event handlers to change the value of pressed to true when the mouse button is pressed, and back to false again when it is released.
let curX;
let curY;
let pressed = false;

// update mouse pointer coordinates
document.addEventListener("mousemove", (e) => {
  curX = e.pageX;
  curY = e.pageY;
});

canvas.addEventListener("mousedown", () => (pressed = true));

canvas.addEventListener("mouseup", () => (pressed = false));
当按下 "透明画布" 按钮时,我们运行一个简单的函数,将整个画布清除回黑色,就像我们之前看到的一样:
¥When the "Clear canvas" button is pressed, we run a simple function that clears the whole canvas back to black, the same way we've seen before:
clearBtn.addEventListener("click", () => {
  ctx.fillStyle = "rgb(0 0 0)";
  ctx.fillRect(0, 0, width, height);
});
这次的绘图循环非常简单 - 如果按下的是 true,我们将绘制一个圆形,其填充样式等于颜色选择器中的值,半径等于范围输入中设置的值。我们必须在测量位置上方 85 像素处绘制圆圈,因为垂直测量是从视口顶部进行的,但我们是相对于画布顶部绘制圆圈,画布顶部从 85 像素高以下开始 工具栏。如果我们仅使用 curY 作为 y 坐标来绘制它,它将显示为比鼠标位置低 85 像素。
¥The drawing loop is pretty simple this time around — if pressed is true, we draw a circle with a fill style equal to the value in the color picker, and a radius equal to the value set in the range input. We have to draw the circle 85 pixels above where we measured it from, because the vertical measurement is taken from the top of the viewport, but we are drawing the circle relative to the top of the canvas, which starts below the 85 pixel-high toolbar. If we drew it with just curY as the y coordinate, it would appear 85 pixels lower than the mouse position.
function draw() {
  if (pressed) {
    ctx.fillStyle = colorPicker.value;
    ctx.beginPath();
    ctx.arc(
      curX,
      curY - 85,
      sizePicker.value,
      degToRad(0),
      degToRad(360),
      false,
    );
    ctx.fill();
  }

  requestAnimationFrame(draw);
}

draw();
所有 <input> 类型都得到良好支持。如果浏览器不支持输入类型,它将回退到纯文本字段。
¥All <input> types are well supported. If a browser doesn't support an input type, it will fall back to a plain text fields.
WebGL
现在是时候把 2D 抛在脑后,快速浏览一下 3D 画布了。3D 画布内容是使用 WebGL API 指定的,这是与 2D 画布 API 完全独立的 API,即使它们都渲染到 <canvas> 元素上。
¥It's now time to leave 2D behind, and take a quick look at 3D canvas. 3D canvas content is specified using the WebGL API, which is a completely separate API from the 2D canvas API, even though they both render onto <canvas> elements.
WebGL 基于 OpenGL(开放图形库),并允许你直接与计算机的 GPU 进行通信。因此,编写原始 WebGL 比常规 JavaScript 更接近 C++ 等底层语言;它相当复杂,但功能却异常强大。
¥WebGL is based on OpenGL (Open Graphics Library), and allows you to communicate directly with the computer's GPU. As such, writing raw WebGL is closer to low level languages such as C++ than regular JavaScript; it is quite complex but incredibly powerful.
使用库
¥Using a library
由于其复杂性,大多数人使用第三方 JavaScript 库(例如 Three.js、PlayCanvas 或 Babylon.js)编写 3D 图形代码。其中大多数以类似的方式工作,提供创建原始和自定义形状、定位查看相机和照明、用纹理覆盖表面等功能。他们为你处理 WebGL,让你在更高的水平上工作。
¥Because of its complexity, most people write 3D graphics code using a third party JavaScript library such as Three.js, PlayCanvas, or Babylon.js. Most of these work in a similar way, providing functionality to create primitive and custom shapes, position viewing cameras and lighting, covering surfaces with textures, and more. They handle the WebGL for you, letting you work on a higher level.
是的,使用其中之一意味着学习另一个新的 API(在本例中为第三方 API),但它们比编码原始 WebGL 简单得多。
¥Yes, using one of these means learning another new API (a third party one, in this case), but they are a lot simpler than coding raw WebGL.
重新创建我们的立方体
¥Recreating our cube
让我们看一个简单的示例,了解如何使用 WebGL 库创建内容。我们将选择 Three.js,因为它是最受欢迎的之一。在本教程中,我们将创建我们之前看到的 3D 旋转立方体。
¥Let's look at a simple example of how to create something with a WebGL library. We'll choose Three.js, as it is one of the most popular ones. In this tutorial we'll create the 3D spinning cube we saw earlier.
- 首先,在新文件夹中制作 threejs-cube/index.html 的本地副本,然后在同一文件夹中保存 metal003.png 的副本。这是我们稍后将用作立方体表面纹理的图片。
- 接下来,再次在与之前相同的文件夹中创建一个名为
script.js的新文件。 - 接下来,你需要安装 Three.js 库。你可以按照 使用 Three.js 构建基本演示 中描述的环境设置步骤进行操作,以便 Three.js 按预期工作。
- 现在我们已经将
three.js附加到我们的页面,我们可以开始编写在script.js中使用它的 JavaScript。让我们从创建一个新场景开始 - 将以下内容添加到script.js文件中:jsconst scene = new THREE.Scene();Scene()构造函数创建一个新场景,它代表我们试图显示的整个 3D 世界。 - 接下来,我们需要一个相机,以便我们可以看到场景。在 3D 图片术语中,摄像机代表观看者在世界中的位置。要创建相机,请添加以下行:
js
const camera = new THREE.PerspectiveCamera( 75, window.innerWidth / window.innerHeight, 0.1, 1000, ); camera.position.z = 5;PerspectiveCamera()构造函数有四个参数:- 视野:屏幕上应可见的相机前面区域的宽度(以度为单位)。
- aspect ratio:通常,这是场景宽度除以场景高度的比率。使用另一个值会扭曲场景(这可能是你想要的,但通常不是)。
- 近平面:在我们停止将它们渲染到屏幕上之前,它们离相机的距离有多近。想一想,当你将指尖越来越靠近双眼之间的空间时,最终你将再也看不到它了。
- 远平面:对象在不再渲染之前距离相机有多远。
- 第三个重要组成部分是渲染器。这是一个渲染给定场景(通过给定相机查看)的对象。我们现在将使用
WebGLRenderer()构造函数创建一个,但稍后我们才会使用它。接下来添加以下行:第一行创建一个新的渲染器,第二行设置渲染器绘制相机视图的大小,第三行将渲染器创建的jsconst renderer = new THREE.WebGLRenderer(); renderer.setSize(window.innerWidth, window.innerHeight); document.body.appendChild(renderer.domElement);<canvas>元素附加到文档的<body>中。现在渲染器绘制的任何内容都将显示在我们的窗口中。 - 接下来,我们要创建将在画布上显示的立方体。在 JavaScript 底部添加以下代码块:
这里还有更多内容需要了解,所以让我们分阶段进行:js
let cube; const loader = new THREE.TextureLoader(); loader.load("metal003.png", (texture) => { texture.wrapS = THREE.RepeatWrapping; texture.wrapT = THREE.RepeatWrapping; texture.repeat.set(2, 2); const geometry = new THREE.BoxGeometry(2.4, 2.4, 2.4); const material = new THREE.MeshLambertMaterial({ map: texture }); cube = new THREE.Mesh(geometry, material); scene.add(cube); draw(); });- 我们首先创建一个
cube全局变量,以便我们可以从代码中的任何位置访问我们的多维数据集。 - 接下来,我们创建一个新的
TextureLoader对象,然后对其调用load()。在这种情况下,load()采用两个参数(尽管它可以采用更多参数):我们想要加载的纹理(我们的 PNG),以及加载纹理时将运行的函数。 - 在这个函数中,我们使用
texture对象的属性来指定我们想要 2 x 2 重复的图片环绕立方体的所有侧面。接下来,我们创建一个新的BoxGeometry对象和一个新的MeshLambertMaterial对象,并将它们放在Mesh中以创建我们的多维数据集。对象通常需要几何形状(它是什么形状)和材质(它的表面是什么样子)。 - 最后,我们将立方体添加到场景中,然后调用
draw()函数来开始动画。
- 我们首先创建一个
- 在定义
draw()之前,我们将在场景中添加一些灯光,让场景变得生动起来;接下来添加以下块:jsconst light = new THREE.AmbientLight("rgb(255 255 255)"); // soft white light scene.add(light); const spotLight = new THREE.SpotLight("rgb(255 255 255)"); spotLight.position.set(100, 1000, 1000); spotLight.castShadow = true; scene.add(spotLight);AmbientLight对象是一种柔和的光线,可以稍微照亮整个场景,就像户外时的太阳一样。另一方面,SpotLight对象是定向轻量,更像是手电筒/手电筒(实际上是聚光灯)。 - 最后,让我们将
draw()函数添加到代码底部:这是相当直观的;在每一帧上,我们在 X 轴和 Y 轴上稍微旋转立方体,然后渲染相机所看到的场景,最后调用jsfunction draw() { cube.rotation.x += 0.01; cube.rotation.y += 0.01; renderer.render(scene, camera); requestAnimationFrame(draw); }requestAnimationFrame()来安排绘制下一帧。
让我们再快速看一下成品应该是什么样子:
¥Let's have another quick look at what the finished product should look like:
你可以 在 GitHub 上找到完成的代码。
¥You can find the finished code on GitHub.
注意:在我们的 GitHub 存储库中,你还可以找到另一个有趣的 3D 立方体示例 - Three.js 视频立方体 (也看到它直播)。这使用
getUserMedia()从计算机网络摄像头获取视频流并将其作为纹理投影到立方体的侧面!¥Note: In our GitHub repo you can also find another interesting 3D cube example — Three.js Video Cube (see it live also). This uses
getUserMedia()to take a video stream from a computer web cam and project it onto the side of the cube as a texture!
概括
¥Summary
此时,你应该对使用 Canvas 和 WebGL 进行图形编程的基础知识以及可以使用这些 API 执行哪些操作有一个有用的了解,并且了解从哪里可以获得更多信息。玩得开心!
¥At this point, you should have a useful idea of the basics of graphics programming using Canvas and WebGL and what you can do with these APIs, as well as a good idea of where to go for further information. Have fun!
也可以看看
¥See also
在这里,我们只介绍了画布的真正基础知识 - 还有很多东西需要学习!以下文章将带你进一步了解。
¥Here we have covered only the real basics of canvas — there is so much more to learn! The below articles will take you further.
- 画布教程 - 一个非常详细的教程系列,比这里介绍的更详细地解释了你应该了解的有关 2D 画布的知识。必读。
- WebGL 教程 — 教授原始 WebGL 编程基础知识的系列。
- 使用 Three.js 构建基本演示 — Three.js 基础教程。我们还有 PlayCanvas 或 Babylon.js 的等效指南。
- 游戏开发 — MDN 上网页游戏开发的登陆页面。这里有一些与 2D 和 3D 画布相关的非常有用的教程和技术 - 请参阅“技术和教程”菜单选项。
示例
¥Examples
- 暴力特雷门琴 — 使用 Web Audio API 生成声音,并使用画布生成漂亮的可视化效果。
- 变声-o-matic — 使用画布可视化来自 Web Audio API 的实时音频数据。